2023-HGU-ML Lecture 7. Clustering
Clustering
- unsupervised learning
- density estimation
- clustering
- dimension reduction
- factor analysis
- representation learning
- Clustering helps us understand the data samples
- clustering → grouping samples in a way that samples in the same group are more similar to each other than to those in another group
- Approaches for clustering
- Connectivity based
- Centroids based
- distribution based
- graph theoretic
- hierarchical clustering
- dendrogram in hierarchical clustering
- bottom-up/top-down manner
- agglomerative (bottom-up)
- at each step, compute distances between all pairs of clusters, then merge the ones with the smallest distance.
- distance between centroids
- distance between the two closest or furthest points
- define the number of clusters
- use cohesion
- at each step, compute distances between all pairs of clusters, then merge the ones with the smallest distance.
- divisive (top-down)
- agglomerative (bottom-up)
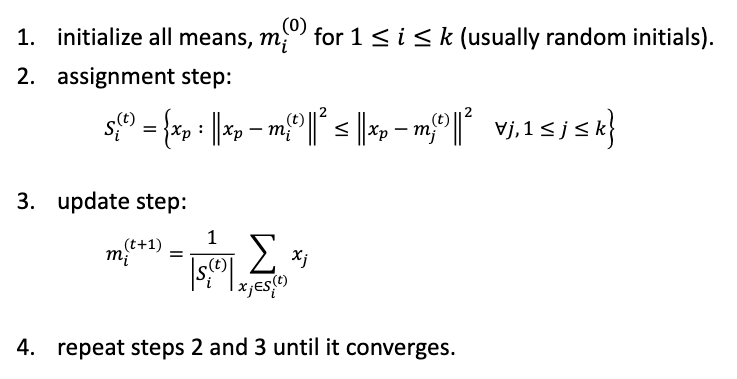
- K-means
- an unsupervised clustering algorithm
- K → number of clusters
- global convergence
- only a local minimum is obtained
- sensitive to initialization
- sensitive to outliers
- Algorithm
- each vector will be assigned to one cluster exclusively
- define dissimilarity measures such as Euclidean distance
- K-means minimizes within cluster point scatter
- It is an optimization problem
- Issues
- initialization is important
- distance function (or metric) should be carefully chosen
- K-means is sensitive to outliers
- kMedoids → using medoids (one of the actual points)
- mixture of Gaussian
- a distribution can be approximated by a weighted sum of component Gaussian densities with parameters
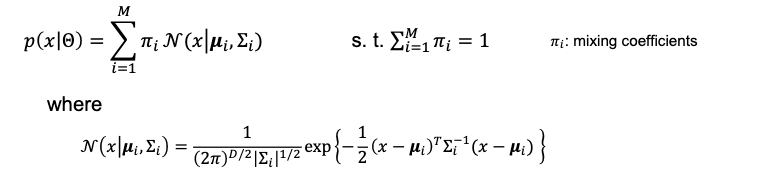
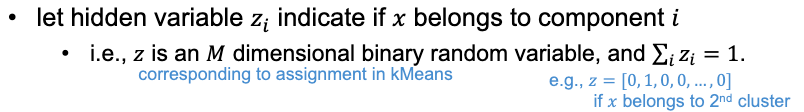
- latent variables
- Gaussian densities with MLE
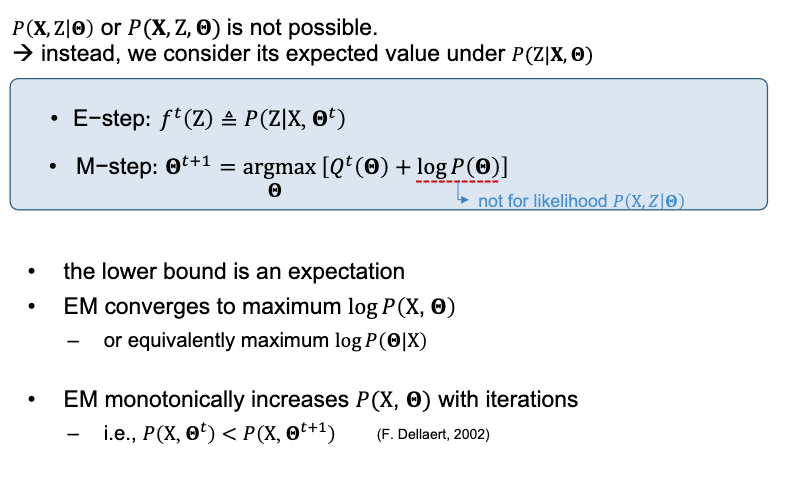
- expectation maximization (EM)
- The Expectation-Maximization algorithm is the algorithm to find the maximum likelihood or maximum a posteriori estimates of parameters in probabilistic models. It repeatedly applies the expectation step and the maximization steps.
- In the expectation step, calculate the expected value of log-likelihood using the estimated value of a parameter. Particularly when dealing with incomplete or missing data, the expectation step involves calculating the posterior probability distribution of the missing data given the observed data and the current parameter estimates.
- The maximization step is finding a variable value that maximizes this expected value. The variable value calculated in the maximization step is used as the estimated value of the next expectation step.
- The process iterates between the E and M steps until convergence, where the parameter estimates stabilize. Using this algorithm, you can easily know one of the parameters or latent variables, when you know the other values.
- an iterative optimization method to estimate parameters, given measurements X when there are hidden (nuisance) variables Z
- it can maximize the posterior probability (or likelihood or joint probability)
- a naive approach would be an alternate optimization between Z and estimate parameters
- EM: lower bound
- http://norman3.github.io/prml/docs/chapter09/4.html
- https://zzaebok.github.io/machine_learning/EM_algorithm/
- E steps
- suppose that we try to maximize joint probability, lower bound B
- should tight log P(X, theta) → B should be maximized with respect to ft(Z)
-
M steps

-
MoG training with EM
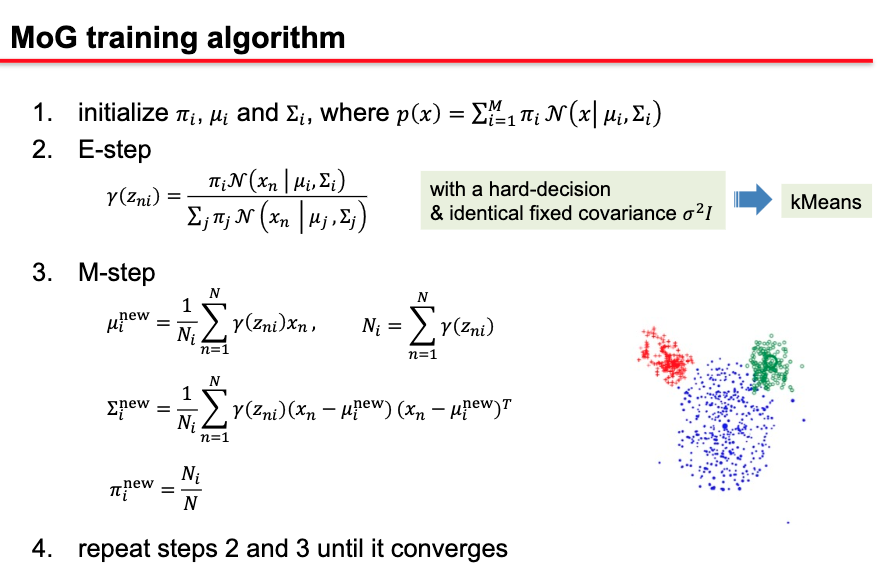
- Difference between MoG and K-means
- EM for mixtures of Gaussians is just like a soft version of K-means, with fixed priors and covariance
- Instead of hard assignments in the E-step, we do soft assignments based on the softmax of the squared Mahalanobis distance from each point to each cluster.
- Each center is moved by weighted means of the data, with weights given by soft assignments
- In K-means, weights are 0 or 1
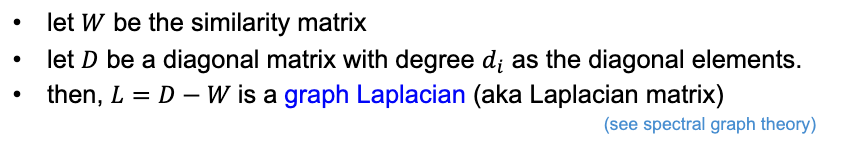
- Spectral clustering
- graphs:
- natural way to represent many types of data
- nodes corresponding to data samples
- edges connecting the nodes
- graph partitioning
- graph cut
- consider a partition of the graph into two parts A and B
- normalized cut
- considers the connectivity with the volume of each group
- normalized cut derivation
- graph cut
- competitive learning
- a clustering algorithm related to humans based on neural network
- when the number of clusters is unknown
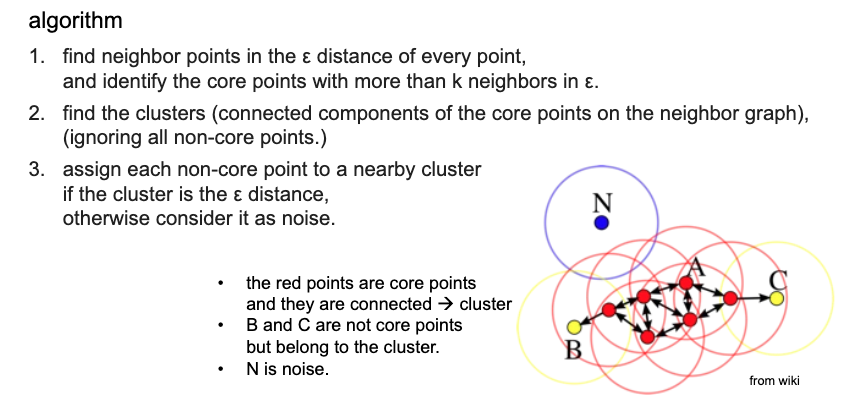
- DBSCAN (Density-based spatial clustering of applications with noise)
- graphs: